


With Universal Google Analytics on its way out and Google Analytics 4 establishing the new standard for Google metrics, it’s (understandably) a confusing time for many digital marketers right now. People are grappling with all sorts of questions, primarily with how they'll be collecting and evaluating data. What starts with what is a metric in Google Analytics?
Soon leads to ‘how do I retarget users?'
Then, ‘what counts as a “session”?'
And with some work, pretty soon, you become a GA4 savant. But first understanding the nuances in Google Analytic's reporting dashboard will set you on your way to not only reach more people with your content but more importantly, the right people.
So let's dive in!
Dimensions and Metrics in Google Analytics
There are two different ways of analyzing marketing data inside Google Analytics: dimensions and metrics.
Both are populated automatically when you connect your website to Google Analytics. You can also create custom dimensions and user metrics to snatch data points specific to your website.
What is a Dimension in Google Analytics 4?
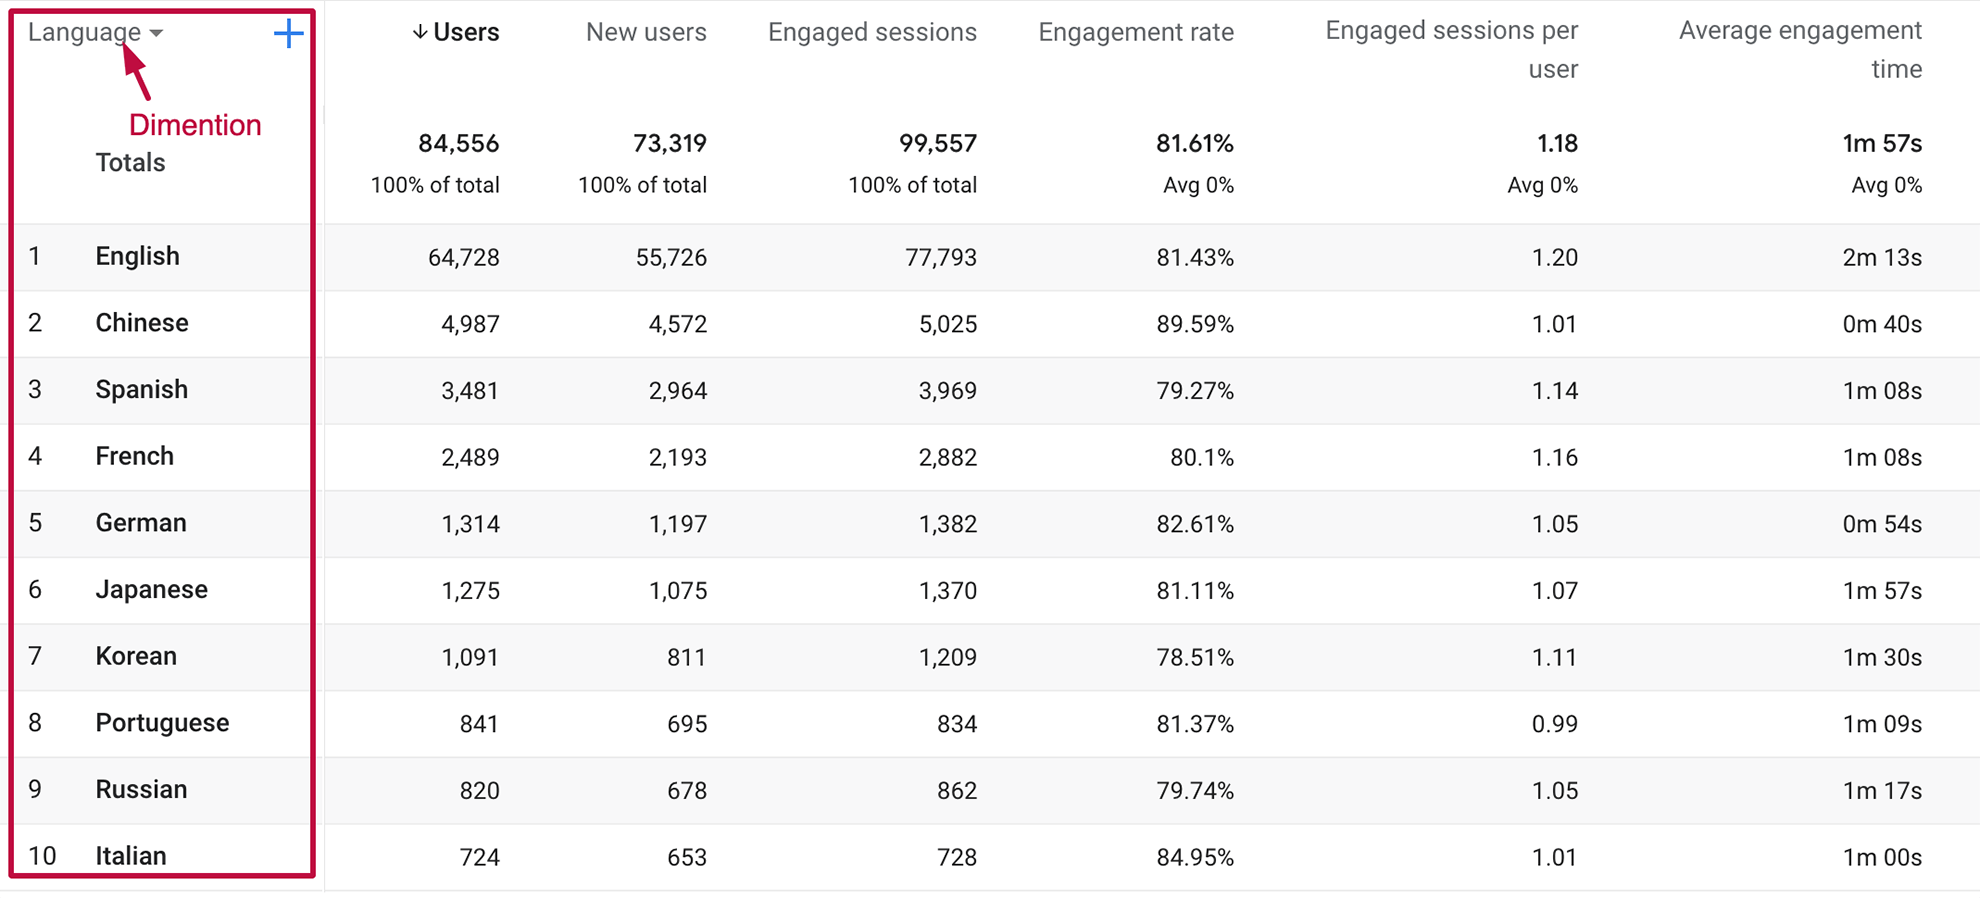
Dimensions are the parameters of your quantitative measurements. They describe your data set more contextually — such as through demographic, geography, and platform — and they allow you to divide up your audience through various filters.
GA4 has 16 default dimensions that you can choose from, and each one of those has a few more secondary dimension values (and even tertiary dimension values) that you can sort as well.
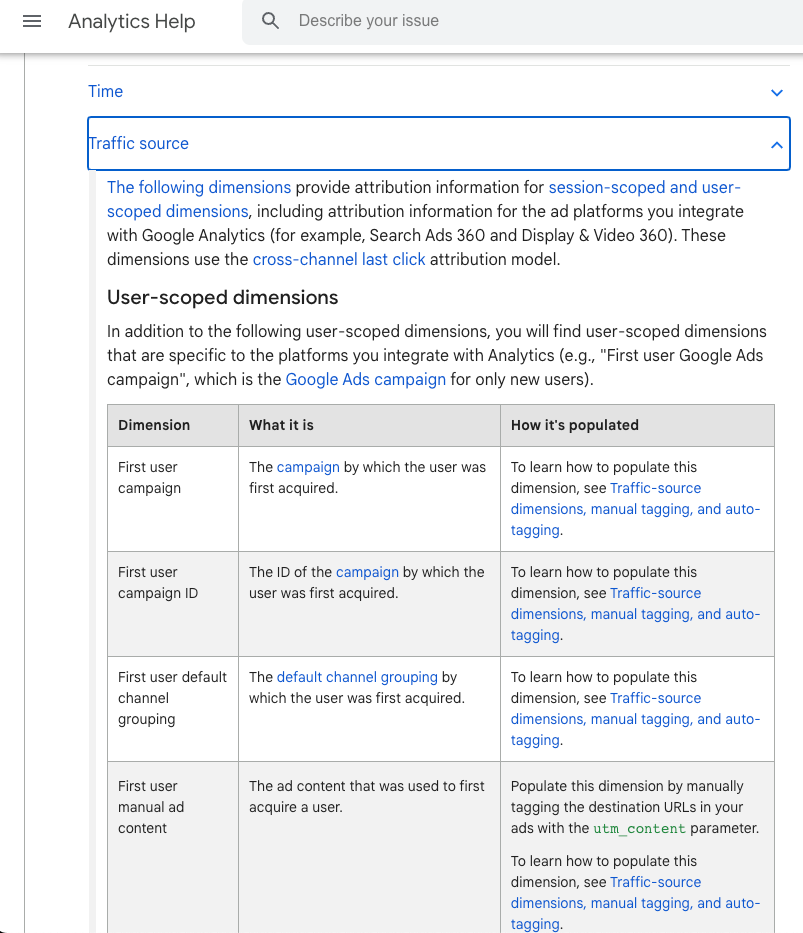
The traffic source dimension, for example, allows you to choose between session-scoped and user-scoped data with more specific secondary dimensions under that.
The “first user manual ad content” secondary dimension is just one example of a “user scoped data set” that you can track.
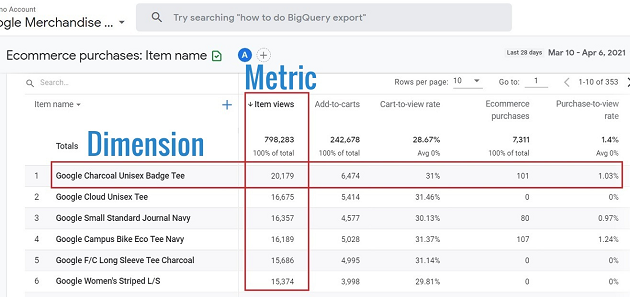
Aside from the category themselves in GA4, you can usually tell whether something is a dimension or a metric based on how it's described. Dimensions almost always use words, whereas metrics use numbers (A.K.A. hard data).
In short, the values are displayed as numbers, but the categories are in words.
Google Analytics only allows you to track two dimensions simultaneously, so if you want to do more, you just have to create a custom dimension report.
What Is a Metric in Google Analytics 4?
As alluded to, while dimensions are more descriptive of the data, metrics are more measurable. They measure things like the number of times a product is added to a cart or a website's bounce rate.
In other words, dimensions provide the categories for the data, while the metrics are the quantitative measurements themselves.
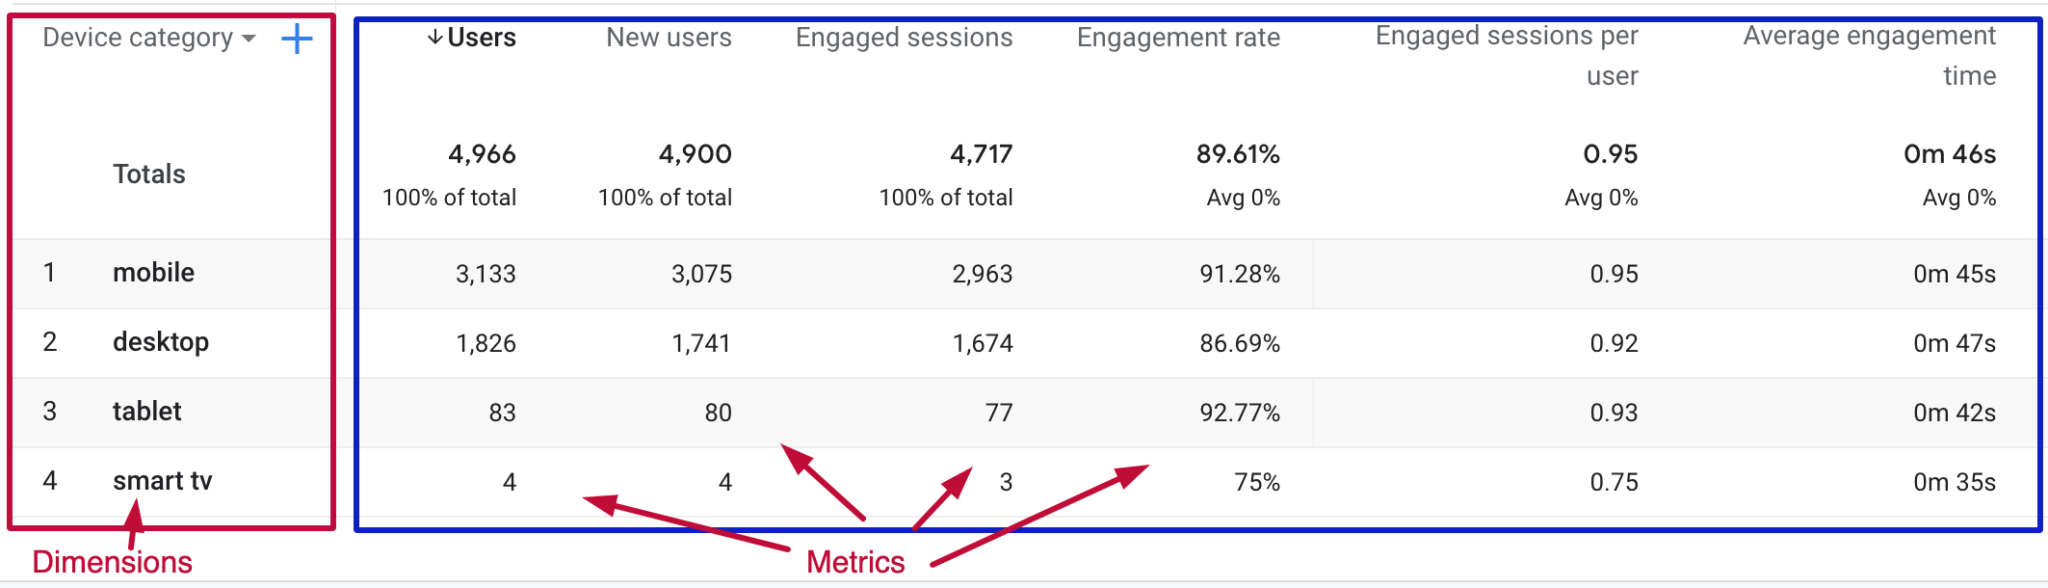
Using these two data sets together makes sense since they're both describing the same information, albeit in different ways.
If the provided quantitative measurements aren't specific enough, you can create custom metrics for your website. This works great if you have different business models or are trying to gauge the effectiveness of a particular online event.
How Many Metrics are There in Google Analytics 4?
Google Analytics 4 has ten different metrics that are trackable, with several secondary metrics listed beneath each. The main 10 include:
- Advertising
- Ecommerce
- Event
- Page/Screen
- Predictive
- Publisher
- Revenue
- Session
- User
- User Lifetime
Many of these metrics may look familiar to those who use universal Google Analytics. In fact, Google even provides a handy “migration equivalence” chart for people who want to see which new metrics align with their predecessors.
The difference between the old GA metrics and those under GA4 is the ability to get a more relevant understanding of your data. Google has worked hard to understand better the unique visitor instead of just tracking hits and conversions.
Events like file downloads and video engagements can now be tracked more efficiently, along with other types of website activities such as page views and in-site search terms. It provides a more complete picture of your website activity and how users interact with it.
How Many Metrics Should I Track? Here are 7

Which specific metrics you track for your website is up to you, but there are a few that are common across industries. Some are primary metrics; others are secondary metrics that are much more specific. Dial in your website goals to find the right combination for you.
Here are the 7 you'll likely want to start tracking immediately, though, since they provide the most comprehensive reporting available.
User
Arguably the best part of GA4 is its ability to individualize the visitor experience. Instead of getting an anonymous spike on your traffic report, the “user” tag creates a Google Analytics report for each person by labeling them with a unique ID number.
This is much handier than you may initially realize. For instance, you can see what devices your user visits your site with, where they're visiting from, and what types of activities they did on your site.
The user-based model that GA4 uses makes for a more privacy-friendly data collection system while also filling in gaps in the reporting that limit a complete understanding of who your audience is.
Event Count
Not only is GA4 more interested in who your users are, but they also want to find out which events on your website are generating the most interest. Since Google's primary goal is connecting users with the information they want, understanding which actions on your page create the most buzz is a great metric to track.
If you have a promotional campaign, event counts are also useful. You can determine which stages of the promotional campaign people are stopping at while also gaining a unique backend understanding of your paid ad campaigns.
For instance, you can take pages that people are stopping at the most and create additional supporting content to increase your sites engagement and overall performance even more.
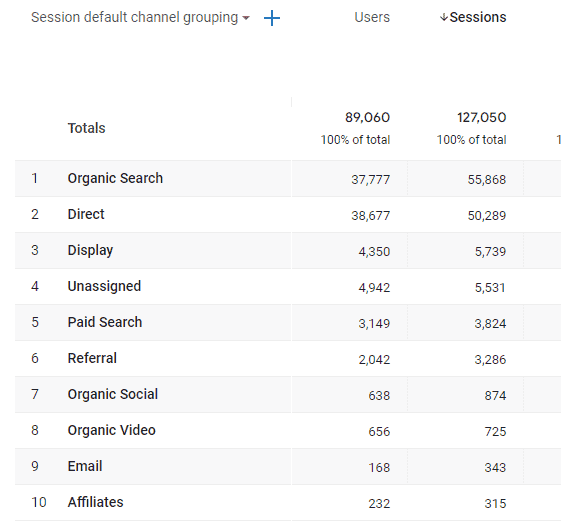
Session Default Channel Grouping
Wouldn't it be nice to know not only what events are clicking with your audience but which one of your channels is delivering the most traffic to your website?
With GA4, not only can you see the major three traffic sources — direct, organic, and referral — but you can also see if it was a display ad, social media post, or email.
In fact, if you apply the UTM code to your tracking, you'll be able to see even more minute details than that.
And, since GA4 is user-focused, the session won't be declared “new” if the same user visits the same page through a different channel. This helps you determine which channels are most effective at driving new visitors instead of retargeting existing users.
Engagement Rate
Usually, we only talk about engagement rates when discussing social media. Every time a user likes, comments or shares one of your posts, that's an “engagement” that demonstrates an active interest from a user in your brand.
GA4 tracks engagement, but in a slightly different way. The three main criteria Google Analytics uses to determine if a person has engaged with your site are:
- If the website or app is in the foreground of their screen for 10 seconds or more
- At least one conversion event has taken place
- Two or more page views
So as mentioned before, you can use this data to see which type of content resonates best with your audience, then build auxiliary content to support it. You can even track engagement rates from each channel to see which audience members are engaging the most.
Engagement rate is a much more valuable metric than bounce rate, which only tracks how often people leave your site in a few seconds or less. With this, you can split test various elements to see how well your pages are performing.
Lifetime Customer Value
Lifetime Customer Value, or LCV, is a powerful tool that tracks which one of your business activities generates the most long-term revenue for your business. Specifically, LCV can be tracked by traffic source, so you'll know which channel to allocate more of your advertising dollars towards.
Understanding your brand's LCV also goes a long way in finding new users. Your ROI goes up if you know that certain sources will create more value in the long run.
Of course, all of this depends on your specific business models. If you have a shorter buying cycle, the value goes up, or vice versa if you have a cycle of several years.
Pages Per Session
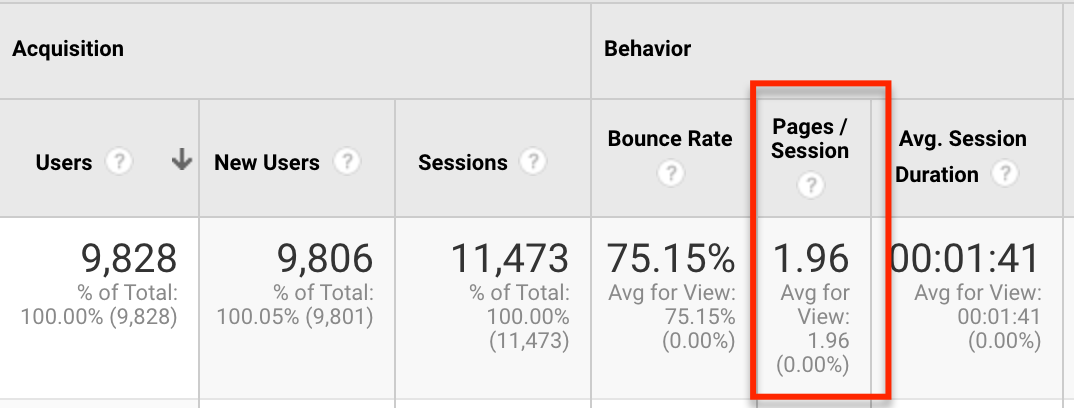
Time on platform is an extremely valuable metric no matter what platform you're tracking, and GA4 makes it more accessible with the “pages per session” metric.
Google Analytics finds this number by dividing the total number of page views by the number of sessions. It's not the most accurate metric in Google Analytics, but it's still a great gauge of how well your customers navigate your site.
Your pages per session data is also a good indication of the navigational ability of your website. If you have a lot of orphan pages, people won't be able to pass from page to page on your site. Conversely, if you have a site with many internal links, your pages per session will reflect a higher number of individual pages viewed.
Be sure to check out Link Whisper to quickly and easily do a site audit, find orphan pages, and build your internal links!
Cost Per Visit
If you have a Google ads account linked to your Google Analytics account, you should be able to determine your cost per lead generation. If you're running ads from a third-party site, such as social media or display ads, you can also set this event up as a conversion.
Nothing beats the ease and accuracy of having it all in-house, however. If you run ads of any kind, GA4 provides a nice and easy way to determine your cost basis for your ads all in one place.
Are There Any Limitations to Google Analytics?
As great as GA4 is, there are a few limitations that you need to be aware of before switching everything over.
Although it's far superior to its predecessor in a number of different ways, certain issues prevent it from being a one-stop shop for all your digital marketing data needs.
Can't Import Historical Data
Universal Google Analytics has been around for a long time, and many websites have a decade's worth of data or more.
Unfortunately, Google Analytics reports can't import this historical data directly into your GA4 account. There are ways to get around it, but it requires a little technical proficiency, which not everyone is comfortable with.
This means that the earlier you move over to GA4, the better.
Reliance on Machine Learning
It's no secret that AI is one of the things carrying us into the future, but it has its limits.
Machine learning requires sampled data and algorithms to cover the gaps and intelligently predict customer behavior.
That makes it reliable, but with an understanding that it's an educated guess, at best.
Slow Reporting
Some reports in GA4 are extremely time-sensitive, and Google Analytics states outright that some processing times may be longer than others.
The good news is that this really only applies to accounts that receive more than 200,000 metric sessions a day, so most people won't be affected. The downside is that can take 1-2 days if your site receives more traffic.
Are Your Google Analytics Up to Date?
Many people are logging into GA4 for the first time and asking themselves what's a metric in Google Analytics? While there are several things to look for when you first log in, understanding the difference between dimensions and metrics is a big first step.
From there, you can get neck deep into the weeds tracking everything your heart desires. GA4, while difficult at first, creates unparalleled access to customer data that can be very important to your online business.
The post What is a Metric in Google Analytics? [Plus 7 You’ll Want To Track in GA4] appeared first on Niche Pursuits.